Market analysis as of October 21, 2026. Forecasts retain the dates and scope of their source reports.
LCD capacity consolidation changes the questions OEMs need to ask
LCD factory closures, production transfers, and changes in utilization describe different supply conditions. For an industrial OEM, the useful question is whether a change affects the panel inside its approved display module. A global capacity trend alone cannot establish that a module will reach end of life, become scarce, or cost more.
The 2026 evidence points to changes in where LCD capacity sits and how producers use it. These changes deserve attention, especially for equipment with long service commitments. The purchasing response should depend on the link between a market event and the actual panel, module, and production route. This article separates reported events from analyst forecasts, then explains how OEMs can use each signal.
What the available 2026 evidence shows
Capacity is shifting toward newer production generations
In March 2026, TrendForce estimated that Gen 8.6 would account for about 26% of global LCD capacity in 2026. It put the share of Gen 5 and earlier lines at 4.7%, down 0.5 percentage points.[1] These are analyst estimates. The generation labels describe factory technology and substrate formats; they do not directly state the supply available for a particular industrial module.
The buyer implication is conditional: a larger share of newer capacity does not prove that a specific legacy panel has a qualified successor. A new line may serve different products. Equally, a declining share for older lines does not prove that every panel made on those lines faces immediate withdrawal.
A production transfer is different from an ended product
TrendForce reported in August that AUO planned to relocate L5D automotive, industrial, and medical production to L6B and L6A. It expected production at the Hwa Ya L3D and L5D facilities to cease in the first half of 2027. These were prospective changes, not confirmed completed closures. The report also projected that Innolux and AUO would together supply below 10% of LCD monitor panels and about 20% of notebook panels by 2028.[2]
The transfer plan raises questions about qualification and continuity. The monitor and notebook projections concern those markets; they do not measure the availability of industrial display modules.
Utilization forecasts describe a shorter time horizon
In September, TrendForce forecast October 2026 utilization of 79.6% for Gen 5 and larger LCD fabs, a decline of 4.2 percentage points from the prior month. Its discussion centered on demand and cost pressures associated with large LCD applications.[3] This was an October forecast, not a measured October result. It does not establish a price trend for an industrial OEM’s module.
Check whether a closure has actually happened
Japan Display’s February 2026 financial presentation states that Mobara production ended in November 2025.[4] That is a completed production event. It differs from an announced future deadline or a forecast about when a plant might stop. Procurement records should preserve that distinction.
Structural consolidation and cyclical cuts can coexist
Our interpretation is that the reports describe two adjustments at different speeds. Changes in factory generation and selective production transfers concern the long-term manufacturing base. A monthly utilization reduction concerns how much of that base producers use during a shorter period. Both can happen together without proving either a general LCD shortage or abundant supply for every application.

The structural question is which production routes remain competitive enough to retain investment. TrendForce links the generation shift to upgrades and cost pressure.[1] The separate question is whether current orders justify running available lines at a higher rate. Its September outlook described temporary cuts against weaker demand.[3] Removing an older route while reducing output elsewhere is therefore not a contradiction.
Selective relocation adds a third distinction: a manufacturer can reduce its factory footprint while planning to retain certain product lines. The AUO plan illustrates this possibility; it does not establish that every transferred panel will remain unchanged.[2] For industrial buyers, transition evidence matters more than a simple count of factories.
These indicators also have different denominators. Capacity share, production area, shipped panels, and finished modules are not interchangeable measures. A larger substrate format does not by itself establish the number of usable panels of a given size or design. The public releases do not provide enough detail to calculate industrial module availability. They support a view of changing production structure, followed by product-specific checks.
Translate the market signal into product exposure
The following analysis is a decision framework, not a measurement of current shortage risk. Start by identifying the upstream panel model in each important module. A module supplier’s part number may describe an assembly that also includes a backlight, touch sensor, cover glass, cable, or controller. The factory event concerns only part of that assembly unless the supplier confirms a wider effect.
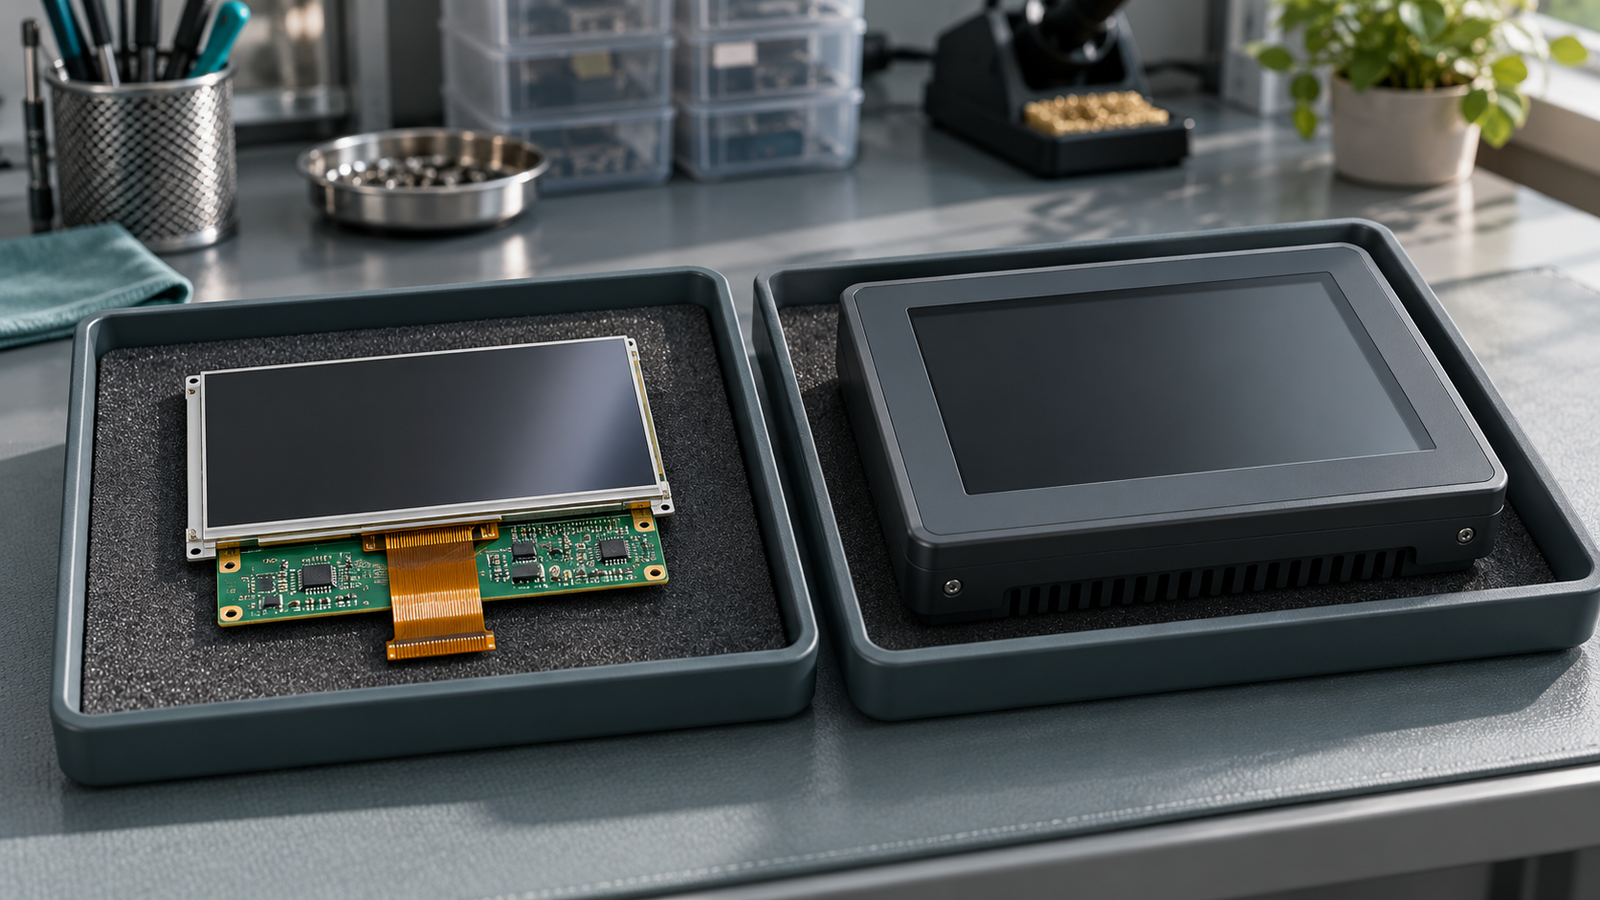
Ask the supplier to connect the event to a named part and manufacturing route. Is the panel produced at the affected factory? Will its production move? Does the transfer preserve the approved construction and specification? Has the manufacturer issued a product change notice or end-of-life notice? A distributor’s interpretation of a headline cannot answer these questions on the manufacturer’s behalf.
When a supplier cannot disclose its full upstream chain, request a written statement about the affected part. A useful statement identifies the event, states whether the supplied module changes, and explains which details remain unconfirmed. Treat an unresolved answer as an information gap that needs follow-up. It is not evidence of an impending shortage.
Match the response to the type of change
| Signal | What it can indicate | Evidence needed for your module | Proportionate response |
|---|---|---|---|
| Permanent production closure | A manufacturing route will no longer operate. | Panel exposure, transfer status, and formal product notices. | Establish continuity before committing to a buffer purchase or redesign. |
| Production transfer | The production location or process may change. | Change notice, sample availability, approval requirements, and transition timing. | Plan validation around the documented change. |
| Lower utilization | Producers plan to use less of the available capacity during a period. | Confirmed lead time, allocation terms, and quote validity for the ordered part. | Review delivery commitments without assuming permanent capacity loss. |
| New-generation capacity | The industry’s production mix is changing. | A suitable panel, commercial availability, and a feasible approval path. | Assess candidates for future designs if they meet the application requirements. |
| More concentrated upstream supply | Several purchasing channels may depend on fewer manufacturing sources. | Panel origin and actual independence of alternate sources. | Separate channel backup from manufacturing backup. |
These responses can overlap. A transfer may coincide with a temporary delivery constraint. The supplier’s product notice and confirmed order commitments should determine the action; the market headline sets the reason to investigate.
Count independent sources, not distributor names
Two distributors can sell modules built around the same panel. They may offer different inventory positions, payment terms, or local support, yet share exposure to the same upstream production change. That provides commercial flexibility without necessarily providing a second manufacturing source.
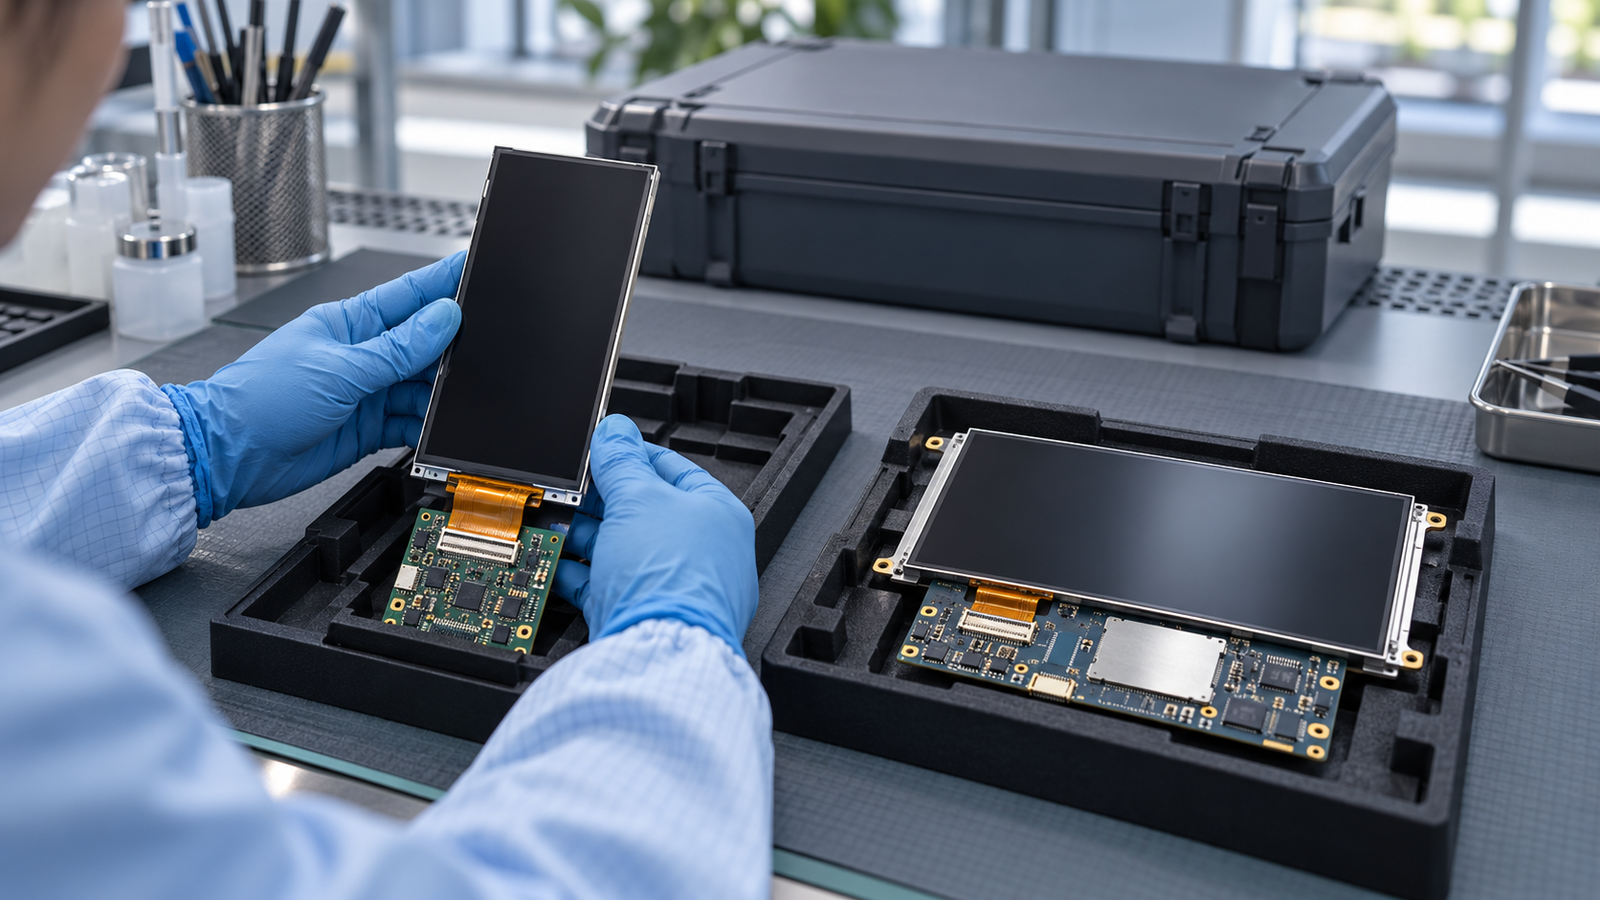
An alternate module may use a different panel manufacturer, but its independence is only useful if the equipment can accept it. Optical performance, outline dimensions, mounting, electrical connections, timing, backlight requirements, and touch behavior can constrain substitution. Qualification time matters as much as the number of supplier names in a purchasing system.
RJY’s guide to LCD panel manufacturers and suppliers explains supplier roles. For this market analysis, the relevant point is narrower: establish which underlying manufacturing dependencies the purchasing options actually share.
A market trend does not set your module price or lifecycle
Capacity share, utilization, price, and lifecycle are related concepts, but they answer different questions. Capacity share describes a production mix. Utilization describes how much available capacity producers use. A quote sets commercial terms for a particular order. A lifecycle notice states what the manufacturer intends for a particular product.
A module quote also covers more than the LCD cell. Assembly, backlight, touch integration, order quantity, testing, freight, and contractual terms can affect the offer. A broad panel-market indicator therefore cannot explain every movement in a finished module’s price.
When quotes change, compare the same part revision, quantity, delivery terms, and validity period. Ask the supplier which element changed. When lead times change, distinguish production lead time from available distributor stock. Those comparisons can support a purchasing decision; a general claim that consolidation must raise prices cannot.
Apply the same discipline to lifecycle claims. Request the manufacturer’s documented position on the exact panel or module. If a discontinuation is confirmed, use a separate discontinued TFT LCD module replacement process. A closure headline alone does not justify treating an approved module as discontinued.
Use the evidence to choose the next action
For a new design, ask how the proposed module’s supply plan fits the equipment’s production and service period. Request the known production route, change-notification process, and any documented lifecycle commitments. Avoid turning an industry forecast into a supplier guarantee.
For an existing design, prioritize modules where the supplier confirms exposure to an announced event. Agree on the next evidence milestone: a formal notice, transferred-production samples, an updated delivery commitment, or an end-of-life schedule. Link internal review dates to those milestones.
Buffer stock can buy time when the required quantity, usable storage period, and transition plan are known. It can also tie up funds without resolving a technical dependency. Evaluate it against verified service demand and the time needed to approve an alternative, rather than against an unsupported shortage prediction.
If your module may be affected, send RJY the module model, available datasheet, application, and required production or service period. State the reported factory event or supplier notice. RJY can use those details to discuss TFT LCD and controller options based on existing modules. Suitability, required customization, and the supply position need project-specific verification; the discussion does not establish a continuity guarantee.
References
- TrendForce, LCD capacity analysis, March 13, 2026. Analyst estimates for 2026.
- TrendForce, Taiwanese LCD production and supply outlook, August 3, 2026. Planned transfers and prospective supply shares.
- TrendForce, October LCD fab utilization outlook, September 21, 2026. Forecast rather than measured October utilization.
- Japan Display, FY26/3 Q3 Corporate Presentation, February 12, 2026, slide 12. Mobara production cessation.